


 By Steve Armstrong
June 7th, 2017
BURLINGTON, ON
Throughout the PARC process there was a continued refrain that larger schools enable more opportunities.

Steve Armstrong
What has been lacking is any concise quantification of this. I’ll share what I have been able to piece together from the data available.
One discussion point surrounded the issue of timetable conflicts. The premise being smaller schools have fewer sections available in combination with fewer course options.
The graph below represents the data from all high schools in Halton. On first viewing the downward trend as we go to the right indeed confirms the notion that larger schools have fewer timetable conflicts. I’ve indicated the overall conflict rates for each of the 4 municipalities on the left hand side.
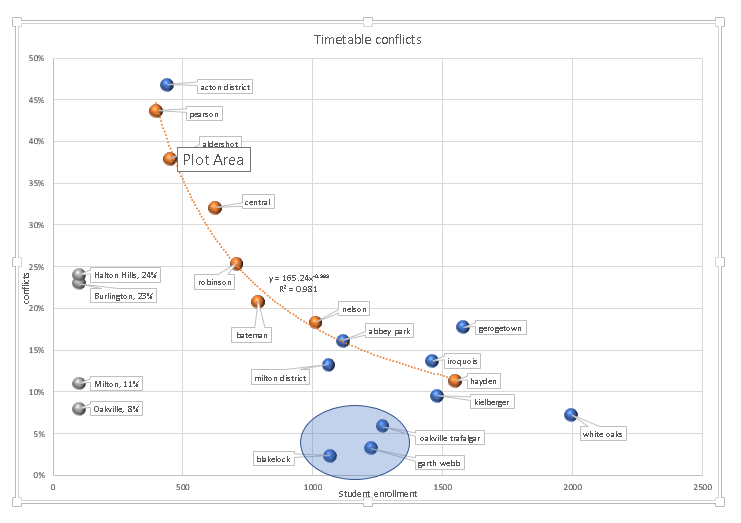 One question I asked, but never received an answer on, concerned the three schools circled at the bottom of the chart set out below.
What is it about those three schools, Blacklock, Oakville Trafalgar and Garth Webb that enables them to have such low conflict rates?
My suggestion is that you might be able to apply that knowledge within the rest of board and achieve dramatic improvements on this metric. Improvements that making schools larger alone will not achieve.
Focusing just on the seven schools in Burlington I’ve added a pair of trend lines to model the data points. The resulting equations create a model for predicting the outcome of various changes in enrollments.
Having such high R squared values (1.0 is perfect) simply means the equations do a very good job of fitting the data, and that enrollment explains most of the effect being modeled.
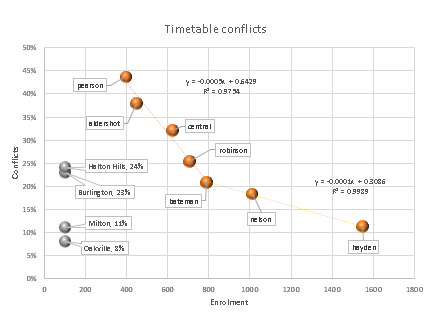
In use what the model predicts is that when looking at changes to enrollment at any school the outcome will fall on these dashed lines.
We can also clearly see that when enrollment is less than about 800 students the impact of enrollment changes is about 5% per 100 students. Above 800 that rate of improvement drops to 1% per 100 students.
As total enrollment grows the conflict rate is expected to drop from the current 23% down to about 20% without closing any schools.
The current recommendation to close two schools would result in the conflict rate dropping to about 16%. A number that would still be twice as high as observed in Oakville, despite heavily disrupting two communities.
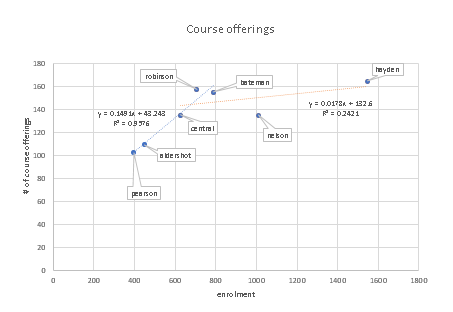
Larger schools are also expected to have a greater number of course offerings, and as the next graph shows this is generally a true statement.
 The data presented was taken from the SIPs (School information profiles) provided to PARC members, and does NOT include online courses.
I’ve drawn in 2 dashed trend lines that are best fits to the data in two overlapping regions.
The blue curve very nicely models the course offerings for schools with under 800 students, and says there is a strong benefit of adding students. The slope tells us that for every 100 students added we would expect 14.9 more course offerings. Since the core courses are already included in the base amount for every school, these would be expanding the options for elective courses.
The orange line provides insight for schools over 600 in size. The effect of adding 100 students is a much smaller 1.78 courses. As an effort to improve on the accuracy I did take a stab at adding data I found for a couple of the other larger schools in Halton. The results did improve the R squared valued (indicating better predicting power), and lowered the benefit to a little over 1 course per 100 students. Since I couldn’t determine if that data was measured in the same way as what was provided by the Board I decided to stick with the known source information.
So, what does this model tell us?
It tells us that for a school to offer a good number of courses we need a critical mass of around 700 students.
For smaller schools, there is significant benefit in increasing the number of students. We would expect 15 new courses per 100 additional students, up to an enrollment of 700. Above critical mass there is a much smaller increase in course options, only 1.78 new courses per 100 new students.
This asymmetry becomes a useful tool when contemplating re balancing enrollments.
For instance: Suppose a boundary change was made between Nelson and Bateman which results in 100 students being relocated to Bateman. Bateman students would be expected to experience an increase of 15 new course offerings. The loss of 100 students at Nelson is predicted to result in loss of only 2 courses. In practice, if the LTAP predicted growth at Nelson of over 100 students by 2020 was instead directed to Bateman then Nelson students wouldn’t likely even see a reduction in course offerings, they just wouldn’t see any increase over what they presently have.
Likewise, suppose 400 students were redirected away from Hayden bringing todays enrolment down to 100% of capacity. Hayden students would see a reduction of only 8 courses, probably less. If Pearson were to receive 250 of those students then its course offering would rise by around 38, and Robinson could also add a number of courses, but given their high course count already may choose instead to lower timetable conflicts. Clearly bringing the overcrowding at Hayden under control by changing boundaries or moving programs would significantly improve all 3 schools.
By combining the perspectives provided by both the timetable conflict data and the course option information much more can be understood about enrollments over a much broader range then a simplistic less than 600 students, greater than 1000 student view of things.
Both perspectives indicate stronger benefits for increasing school enrollments up to around the 700‐800 range.
Below that critical mass the focus is on adding course options, above that point the focus is on adding more sections, which continues to reduce timetable conflict rates. This plateauing on the course options side is inevitable since the Ministry of education has a finite number of courses that can be offered.
With further work this modeling could be improved.
Related article:
Another example of where parent involvement made the difference.
Editor’s note: Steve Armstrong is an engineer. He was a PAR Committee member representing students from Lester B. Pearson high school. One wonders what the Board o Education Planning staff will do with this data.


Nothing if it doesn’t suit their agenda.